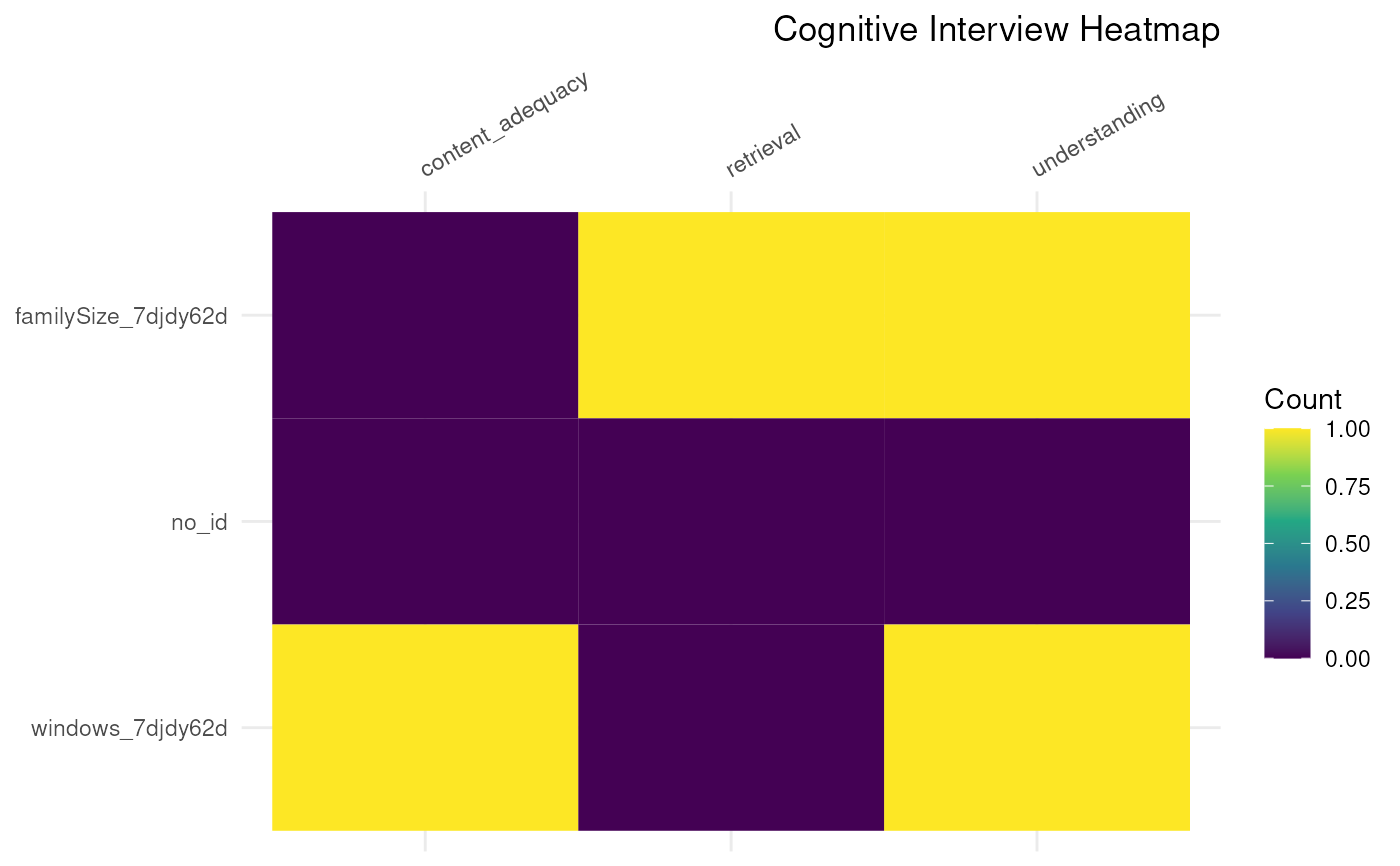
When conducting cognitive interviews, it can be useful to quickly inspect the code distributions for each item. These heatmaps facilitate that process.
Usage
ci_heatmap(
  x,
  nrmSpec = NULL,
  language = nrmSpec$defaultLanguage,
  wrapLabels = 80,
  itemOrder = NULL,
  itemLabels = NULL,
  itemIdentifier = "uiid",
  codingScheme = "peterson",
  itemlab = NULL,
  codelab = NULL,
  freqlab = "Count",
  plotTitle = "Cognitive Interview Heatmap",
  fillScale = ggplot2::scale_fill_viridis_c(),
  theme = ggplot2::theme_minimal()
)
Arguments
- x
The object with the parsed coded source(s) as resulting from a call to
parse_source()orparse_sources().- nrmSpec
Optionally, an imported Narrative Response Model specification, as imported with
ci_import_nrm_spec(), which will then be used to obtain the item labels.- language
If
nrmSpecis specified, the language to use.- wrapLabels
Whether to wrap the labels; if not
NULL, the number of character to wrap at.- itemOrder, itemLabels
Instead of specifying an NRM specification, you can also directly specify the item order and item labels.
itemOrderis a character vector of item identifiers, anditemLabelsis a named character vector of item labels, where each value's name is the corresponding item identifier. IfitemLabelsis provided butitemOrderis not, the order of theitemLabelis used.- itemIdentifier
The column identifying the items; the class instance identifier prefix, e.g. if item identifiers are specified as
[[uiid:familySize_7djdy62d]], theitemIdentifierto pass here is"uiid".- codingScheme
The coding scheme, either as a string if it represents one of the cognitive interviewig coding schemes provided with the
rockpackage, or as a coding scheme resulting from a call tocreate_codingScheme().- itemlab, codelab, freqlab
Labels to use for the item and code axes and for the frequency color legend (
NULLto omit the label).- plotTitle
The title to use for the plot
- fillScale
Convenient way to specify the fill scale (the colours)
- theme
Convenient way to specify the
ggplot2::ggplot()theme.
Examples
examplePath <- file.path(system.file(package="rock"), 'extdata');
parsedCI <- rock::parse_source(
  file.path(examplePath,
            "ci_example_1.rock")
);

rock::ci_heatmap(parsedCI,
                 codingScheme = "peterson");